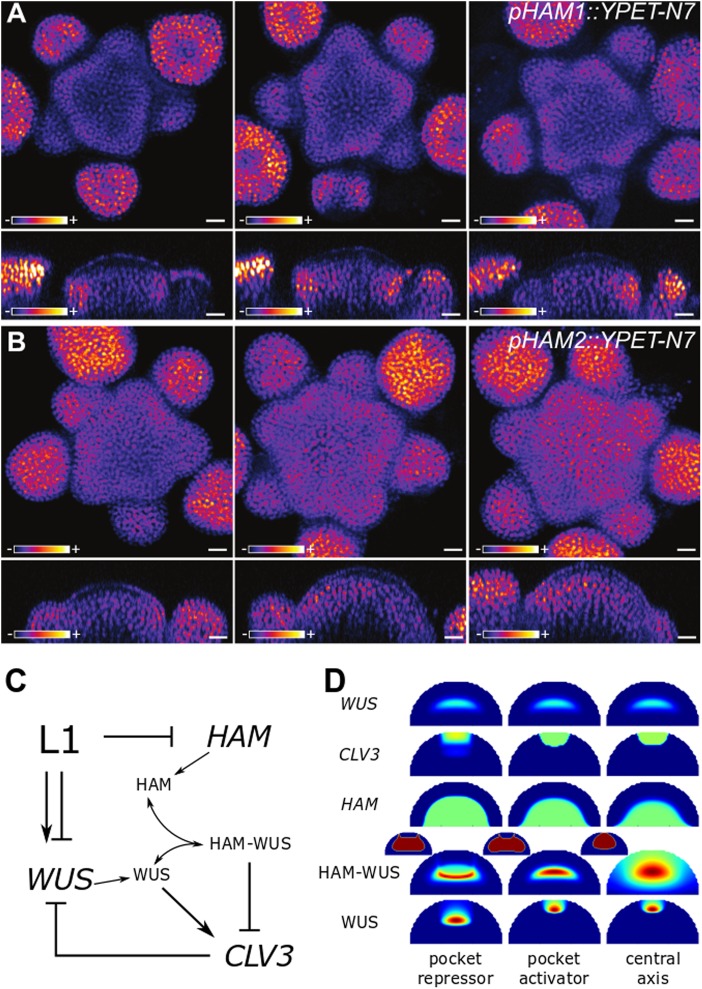
Fig. 1.
Expression of pHAM1::YPET-N7 a and pHAM2::YPET-N7 b in representative meristems of different sizes. Meristems were obtained by growing plants on soil, on soil supplied with fertiliser, or on a mixture of soil and sand, leading to meristems of various sizes. Top images show z-projections (sum slices) and bottom images show sections through the centre of the inflorescence meristem. YPET signal is represented using the Fire lookup table of ImageJ. Scale bar: 10 μm. c Schematic of the model: the epidermis controls WUS expression with an IFF-like motif (both inducing and repressing its expression), as introduced in Gruel et al.13 The epidermis also represses the expression of HAM. HAM and WUS monomers can heterodimerize; WUS monomer induces the expression of CLV3 while the heterodimer represses it. Finally, the CLV3 peptide represses the expression of WUS. d Parameter optimisations result in three possible behaviours. The panel presents the expression of WUS, CLV3 and HAM on a colour scale varying from blue (no expression) to green (optimisation target expression) to red (twice the target expression). HAM–WUS dimers and WUS monomers are plotted on a relative colour scale varying from blue (minimal concentration) to red (maximal concentration). Additionally the outline of the pocket formed by the HAM–WUS dimers is displayed (smaller meristems), in blue are concentrations below the maximal value found in the epidermis and in red are concentrations above this value

