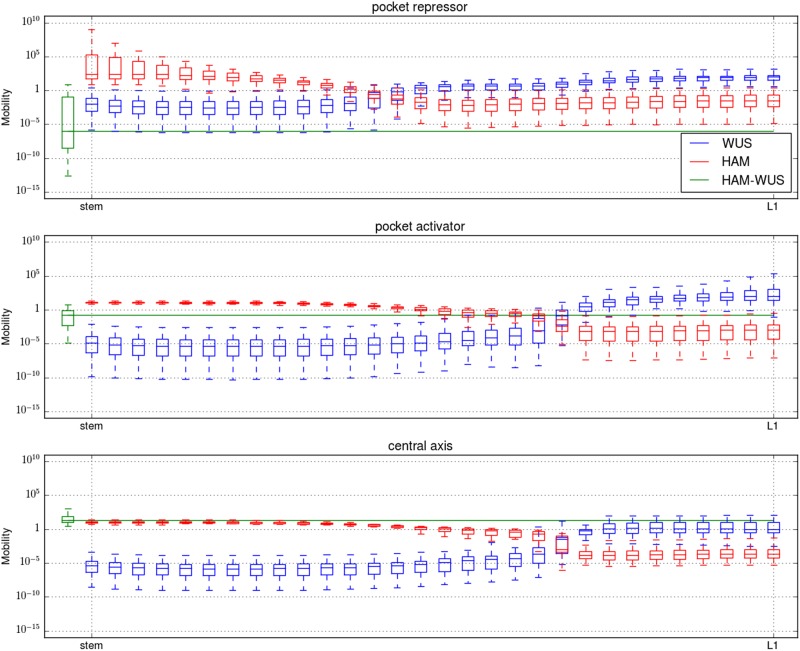
Fig. 2.
The dimer mobility is computed following and monomer mobility following with D the diffusion rate of the considered molecule, g its degradation rate, b dimers dissociation rate, f dimers formation rate and [P] the concentration of the monomeric partner of the considered monomer. For all three panels, the y-axis is the mobility on a logarithmic scale, the x-axis is the central axis of the meristem, with the stem to the left and the apex to the right. For each considered molecule (WUS: red, HAM: green and HAM–WUS: blue), and each position, the mobility value is presented as a boxplot encompassing all optimised parameters belonging to one of the three parameter set categories (the boxes mark the upper and lower quartiles of the data and the line the median, the whiskers extend to 1.5× interquartile range)

