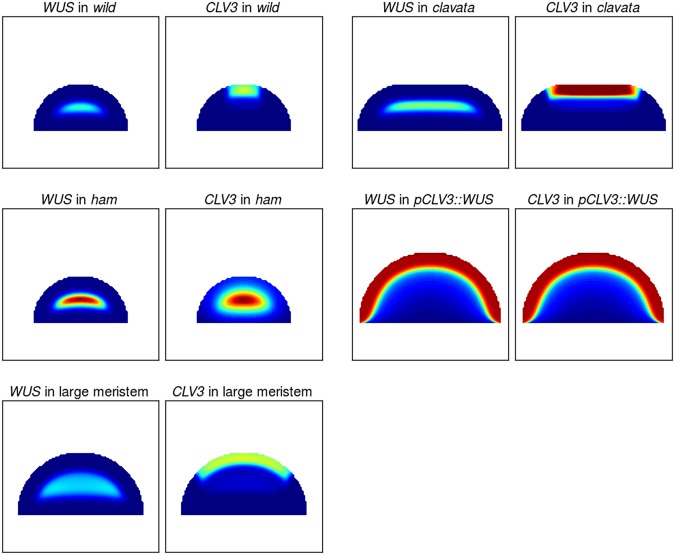
Fig. 3.
Each panel plots either the expression of WUS or CLV3 in various scenarios (wild type, clavata, ham, pCLV3::WUS and large meristem) using an example parameter set from the “pocket repressor” category and where parameters have been adjusted to represent the mutants (Materials and methods). The colour map for wild type, clavata and large meristems is the same, varying from blue (no expression) to red (twice the wild-type target expression for optimisations (green) and any value above). The colour map in the ham and pCLV3::WUS scenarios varies between blue and red (minimum and maximum gene expression in the considered settings)

