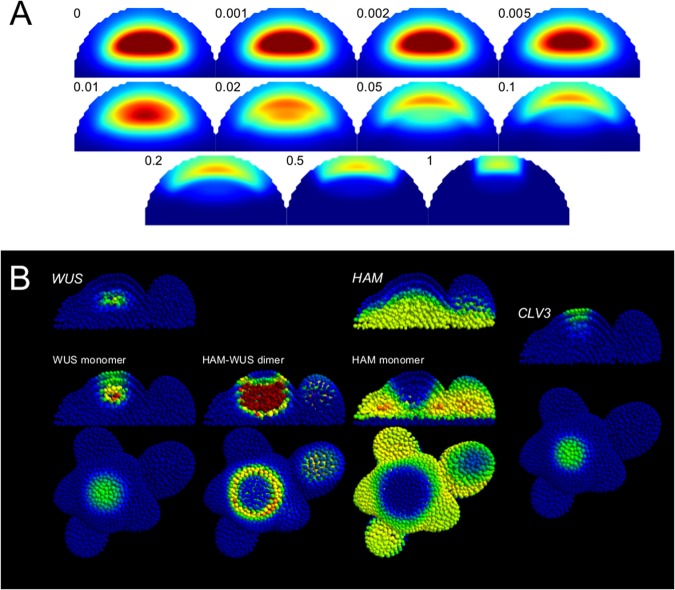
Fig. 6.
a CLV3 domain shift. For the example parameter set, the production of the HAM genes varies from 0 to 1, the factor is indicated along each panel. The colour scale for CLV3 expression varies from blue (null) to dark red (twice the wild-type expression and above). b Example behaviour of a parameter set optimised on a realistic template. The gene-expression colour map for genes is blue for no expression, green for optimisation target expression, red for twice the target expression and any value above. The colour map for the monomers varies from blue (minimal concentration) to red (maximal concentration). In order to facilitate the visualisation of the pocket formed by the dimer, any value above the maximum dimer concentration in the L1 is displayed with red; blue indicates a low concentration

