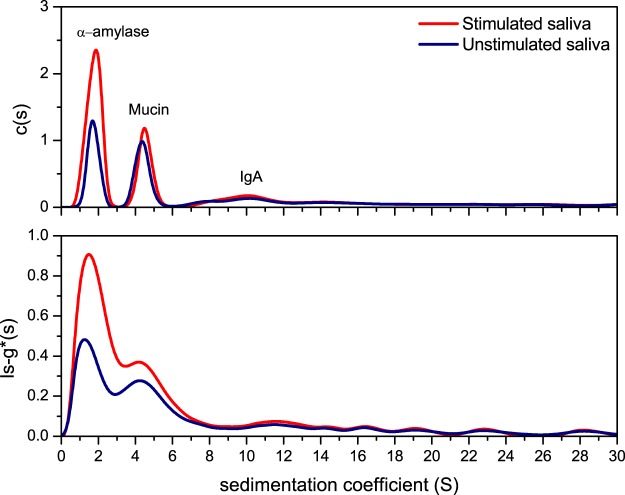
Figure 1.
Sedimentation velocity, ls-g*(s) and c(s) analysis for pooled saliva. The plots show the sedimentation coefficient distributions for unstimulated (US) and stimulated (SS) samples. Saliva fingerprinting is based on the sedimentation coefficient distribution, directly derived by fitting the Lamm equation in SEDFIT20,25,46. The plots shows typical sedimentation coefficient profiles for the sedimentation species present in saliva analysed by two methods, c(s) (top) and ls-g*(s) (bottom). Peaks are identified based on their molecular weight (directly related to the sedimentation coefficient) and their relative concentration. Estimations have been confirmed with individual runs for porcine α-amylase and bovine submaxillary mucin. The US and SS distributions are shown in blue and red respectively. Rotor speed: 40 000 rpm (120 000 g), 20.0 °C.

