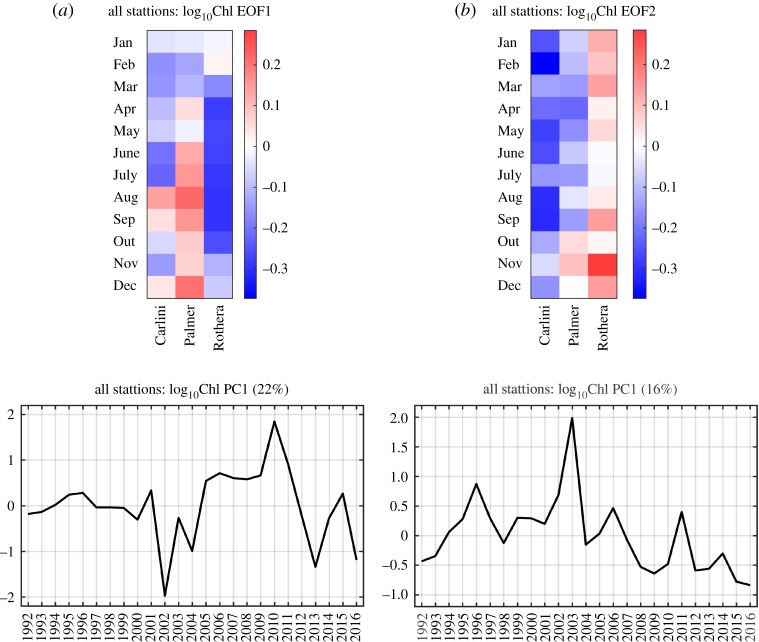
Figure 6.
EOF and PC time series of the Chl datasets for all three stations. The set of EOF and PC patterns from the second case of the EOF analysis is presented for the first mode (mode 1, a) and the second mode (mode 2, b). The red colours represent positive log10Chl anomalies and the blue colours represent negative log10Chl anomalies in the EOF plots. The percentage explained by each mode is represented in the corresponding PC time series.

