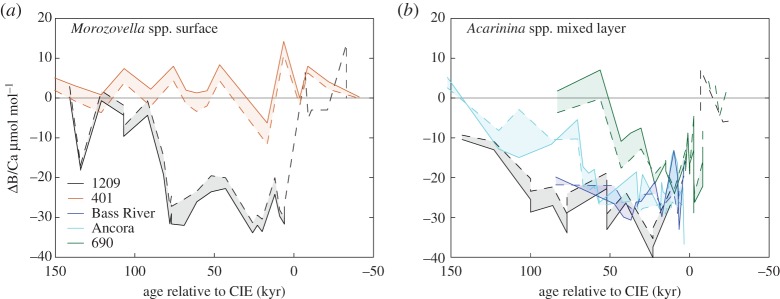
Figure 5.
Estimation of the potential contribution of regional changes in salinity to B/Ca records. B/Ca anomalies (ΔB/Ca, µmol mol−1) were computed by subtracting a pre-CIE average value from each point in the record (a,b). Paired planktonic foraminiferal Mg/Ca and δ18O were used to estimate δ18Osw changes; regional δ18Osw–salinity relationships were used to translate δ18Osw to ΔSSS. Plotted here are ΔB/Ca records uncorrected (dashed line) and corrected (bold line) for regional changes in salinity using B/Ca salinity sensitivity of modern O. universa derived in laboratory culture experiments [50]. The shaded region represents the potential contribution of local salinity changes to ΔB/Ca records. Age is denoted in kiloyears relative to the CIE. (Online version in colour.)

