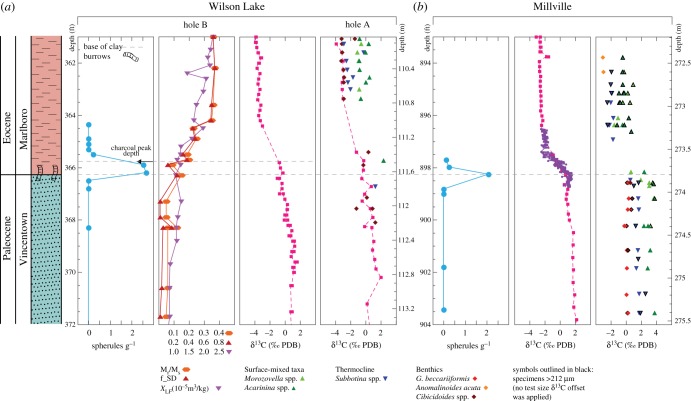
Figure 9.
An expanded view of the CIE onset on the palaeo-continental shelf at sites Wilson Lake and Millville demonstrating the order of events at the P-E boundary. Spherule abundance at Wilson Lake B and Millville [18], bulk carbonate δ13C at Wilson Lake B and Millville [19], bulk carbonate and foraminiferal δ13C at Wilson Lake A [92], foraminiferal isotopes at Millville [93] and magnetics from Wilson Lake B [93] are shown for comparison. Arrow indicates the depth of the peak in charcoal abundance at Wilson Lake B [94]. The horizontal dashed grey lines identify the apparent offset between an initial decrease in δ13C measured in bulk carbonate and the spherule peak, which coincides with the base of the Marlboro Clay and defines the start of the CIE onset and P-E boundary (shown in excursion foraminiferal and bulk δ13C values above). A 5 du depth adjustment is applied to the Wilson Lake A record for comparison with Wilson Lake B. Ratio of saturation remanence to saturation magnetization (Mr/Ms), low-field magnetic susceptibility (XLF) and volume-weighted SD fraction (fSD) at Wilson Lake B from Kent et al. [93] illustrates the abrupt rise in magnetization coincident with the peak in charcoal abundance. The foraminiferal isotopes at Millville are not corrected for a δ13C size offset and samples containing specimens greater than 212 µm are outlined in black. The samples through the onset at Millville are assembled from a number of different sampling campaigns and we note that samples could be shifted up or down ca 10 cm due to depletion of the core and shrinkage from their absolute positions.

