. 2018 Sep 5;59(8):951–959. doi: 10.3349/ymj.2018.59.8.951

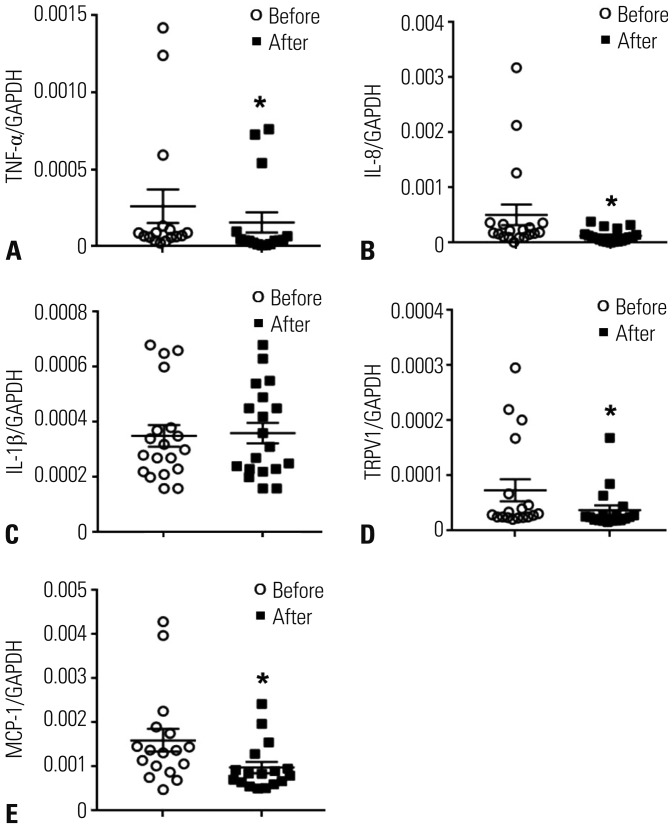
Fig. 6. Inflammatory biomarkers before and after treatment. (A) TNF-α, (B) IL-8, (C) IL-1β, (D) TRPV1, and (E) MCP-1 were measured by qRT-PCR. GAPDH was used as the endogenous control. The Ct values of TNF-α, IL-8, TRPV1, and MCP-1 were normalized to GAPDH using the 2−ΔΔCt method. Some samples were not sufficient to perform qRT-PCR, and only reliable qRT-PCR data points were used for analysis (TNF-α: 16; IL-8: 18; IL-1β: 19; TRPV1: 18; MCP-1: 14). *p<0.05. TNF-α, tumor necrosis factor-alpha; IL-8, interleukin 8; IL-1β, interleukin-1 beta; TRPV1, transient receptor potential vanilloid 1; MCP-1, monocyte chemoattractant protein-1; qRT-PCR, quantitative real time polymerase chain reaction; GAPDH, glyceraldehyde 3-phosphate dehydrogenase.

Fig. 6