
FIGURE 2.
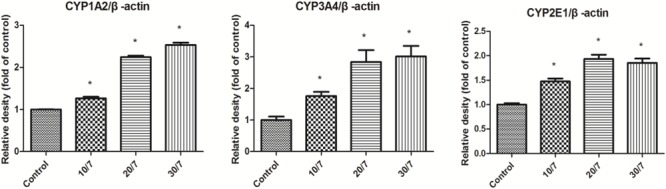
Relative protein expression ration of CYP1A2, CYP3A4, and CYP2E1 in rat liver determined by Western Blot. Control, the control group treated with saline; 10/7, low-dose group received 10 g kg-1day-1 FA extraction; 20/7, medium-dose group received 20 g kg-1day-1 FA extraction; and 30/7, high-dose group received 30 g kg-1day-1 FA extraction. Values are means ± SD and ∗P < 0.05 compared with control group.