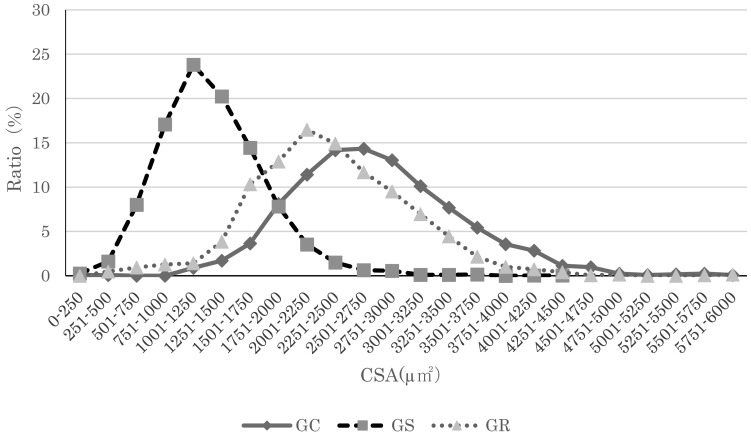
Fig. 2.
Soleus myofiber cross-sectional area distributions. Myofiber cross-sectional area distribution for GK rats in all groups. The peak in the Suspension group for both types of rats shifted to the left, indicating muscle atrophy. Compared to the Suspension group, the peak in the Reload group shifted left, indicating a tendency toward recovery of myofiber cross-sectional area.

