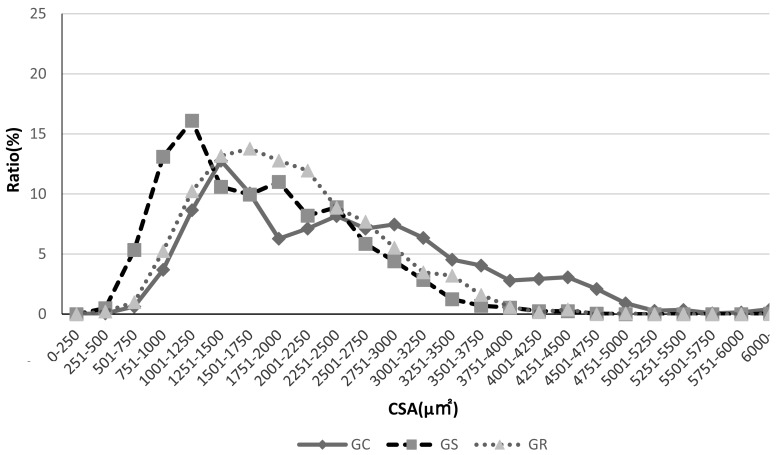
Fig. 4.
Plantaris muscle myofiber cross-sectional area distribution. Myofiber cross-sectional area distribution for GK rats in all groups.
The GK rats in the GS group showed a peak that is clearly on the left, indicating a higher number of small-bore fibers. In contrast, the GR group shows a peak shift to the right, indicating a tendency for myofiber cross-sectional area to recover.

