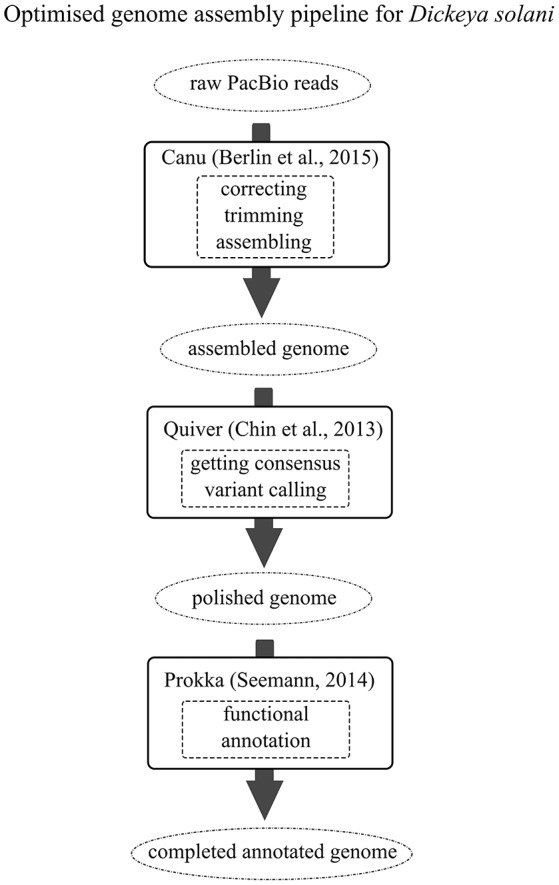
Figure 1.

The optimized genome assembly pipeline for D. solani. Black arrows indicate the genomic assembly pipeline to follow. Different completeness stages of the constructed genome are presented within the dotted circles. Black boxes include data on the open source software and the corresponding literature references. Functions provided by certain software are enclosed within the dashed boxes.
