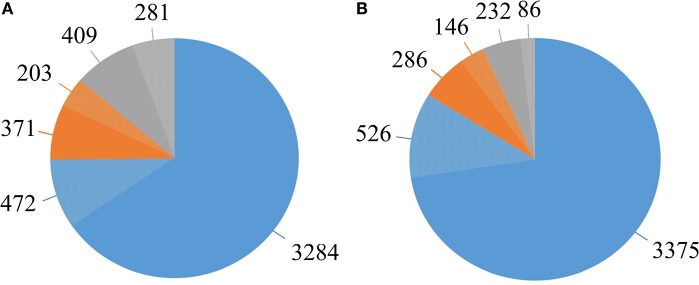
Figure 5.
The D. solani pangenome shape. (A) Pangenome shape based on the number of genes in all 14 strains. (B) Pangenome shape after exclusion of strain RNS 05.1.2A. Blue—represents the core genome. Orange—represents the accessory genome. Gray—represents the unique genome. Lighter shades of each color represent the fractions of genes annotated as hypothetical proteins.

