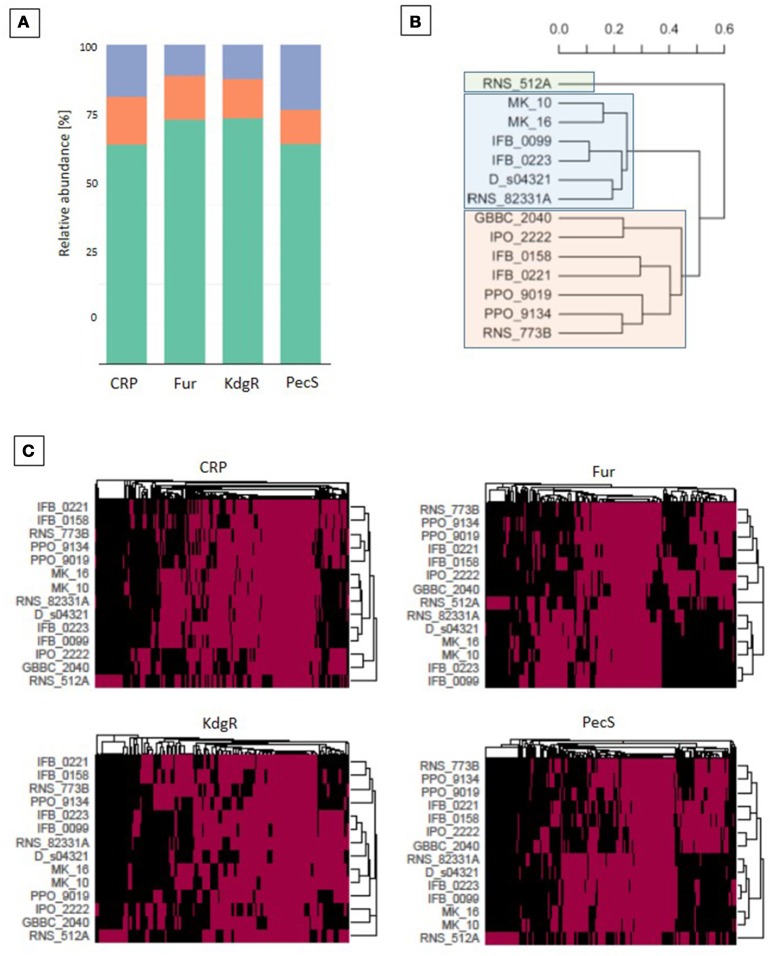
Figure 7.
Regulon analysis based on binding sites predictions. Predictions of the transcription regulators (CRP, Fur, KdgR, and PecS) binding sites were made with the use of MAST version 4.10.1. (Bailey and Elkan, 1994) and the version 1.62b of the Bio.motifs package from the Biopython library (Cock et al., 2009). (A) The regulon representation for the 4 transcription regulators (TFs): in orange for core, green for accessory, violet for unique TF targets. (B) Phylogenetic tree based on the total regulons predicted for the 4 TFs. The UPGMA methods on Jaccard distance were utilized for phylogenetic analysis. (C) Heatmaps for CRP, Fur, KdgR and PecS TFs, which represent all predicted genes that are putatively regulated by the selected TF. A red box indicates the presence whereas a black one indicates the absence of a TF binding site in the upstream region of the gene.

