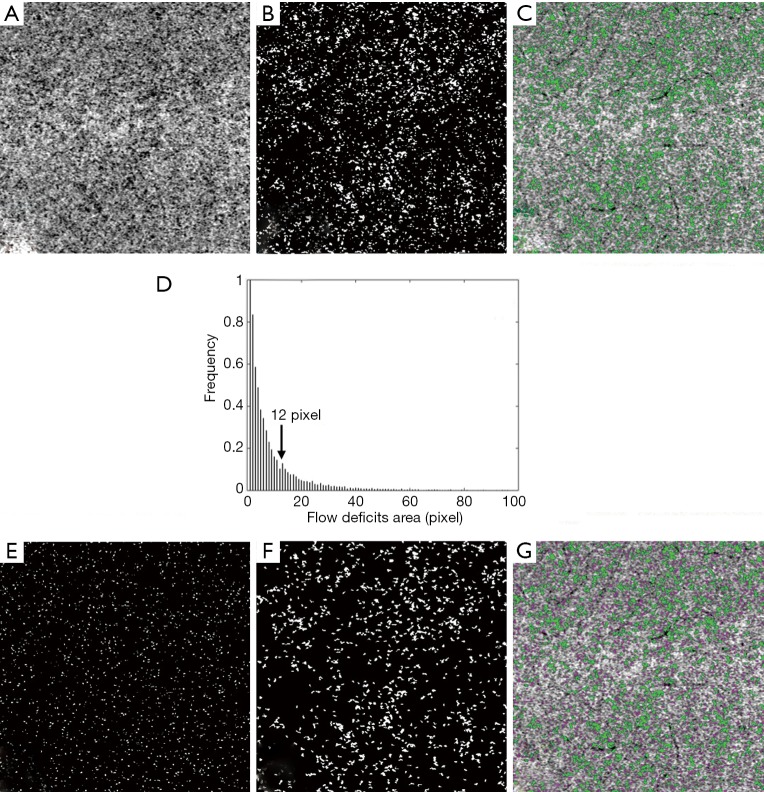
Figure 1.
An example of the flow deficit measurement procedure using the thresholding method on an en face swept source optical coherence tomography angiography image of the choriocapillaris from a normal subject. (A) Structure compensated choriocapillaris en face angiogram with tailing artifact removed; (B) flow deficit map including all sizes of identified flow deficits; (C) overlaid choriocapillaris angiogram with flow deficits; (D) bi-modal histogram distribution showing the area sizes of flow deficits from which the average intercapillary distance is identified as 12 pixels from the valley value; (E) flow deficits smaller than intercapillary spacing; (F) the flow deficits larger than the intercapillary spacing, which are considered as true flow deficits; (G) the overlaid choriocapillaris angiogram with small flow deficits in purple and true flow deficits in green.

