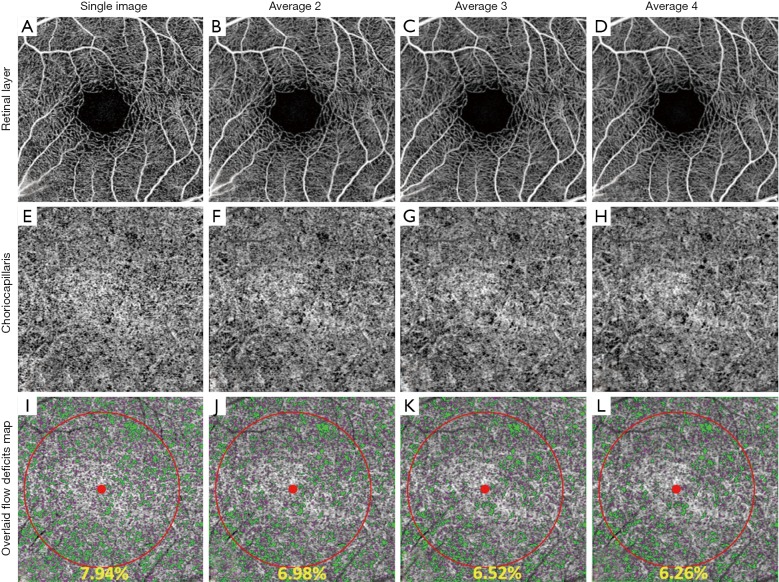
Figure 2.
Example of retinal and choriocapillaris angiograms from a single image and images averaged 2, 3 and 4 times. (A,B,C,D) Retinal angiograms without averaging and averaged 2, 3 and 4 times; (E,F,G,H) choriocapillaris angiograms without averaging and averaged 2, 3 and 4 times; (I,J,K,L) flow deficit measurements based on a single image and images averaged 2, 3 and 4 times. Purple indicates the small flow deficits that are consistent with normal ICD; green indicates the true flow deficits identified through the procedure, and the yellow percentage indicates the percent of true flow deficits within the red circle. ICD, intercapillary distances.

