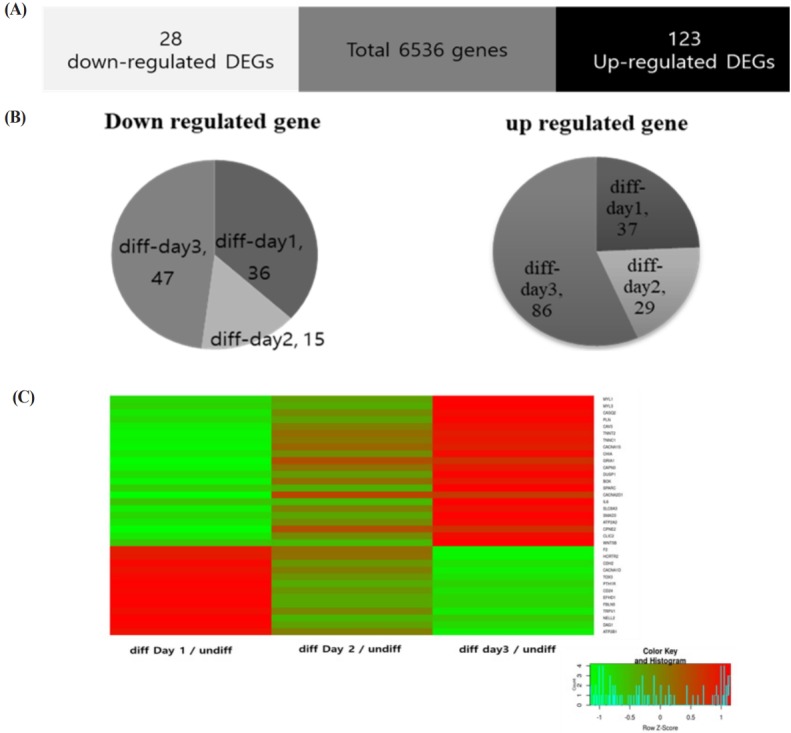
Figure 2.

The Venn diagrams and heat map for differentially expressed genes (DEGs) during myotube differentiation. (A) Enhanced DEGs during myotube differentiation in QM7 cells (white bars, >2-fold down-regulated genes; black bars, >2-fold up-regulated genes; gray bars, not differentially expressed). (B) The three pie charts displayed the compositions of the DEGs during myotube differentiation periods (day 1 to day 3) compared to the undifferentiated QM7 cells. (C) Heatmap analysis of calcium-related DEGs during myotube differentiation periods (day 1 to day 3) compared to the undifferentiated QM7 cells. Color from green to red indicates low to high expression.
