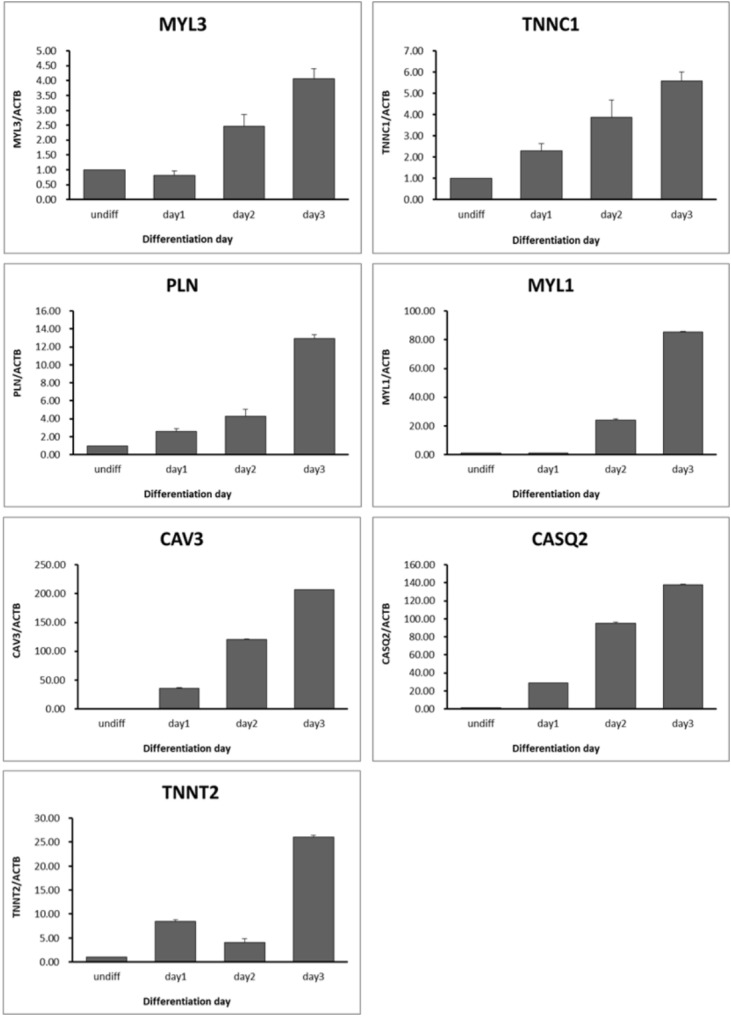
Figure 5.

Expression patterns of calcium-related genes during myotube differentiation. Relative expression levels of candidate genes were analyzed by quantitative reverse-transcription polymerase chain reaction (qRT-PCR). (n = 3, p<0.005). Quantitative analysis was performed using the 2−ΔΔCt method by normalization with beta-actin gene.
