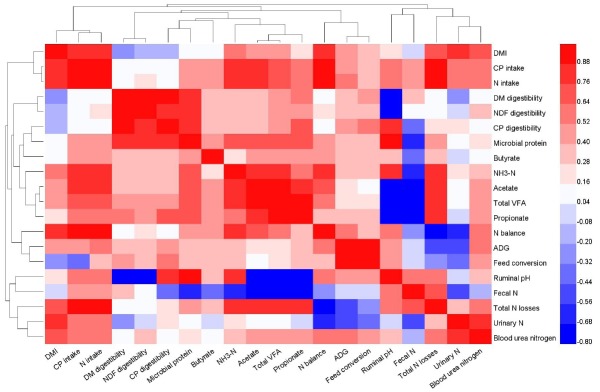
Figure 4.
Heatmap matrix of the Pearson’s correlation analysis showing the correlation coefficients among the evaluated measurements. ADG, average daily gain; CP, crude protein; DM, dry matter; DMI, dry matter intake; N, nitrogen; NDF, neutral detergent fibre; NH3-N, ammonia nitrogen; VFA, volatile fatty acid.

