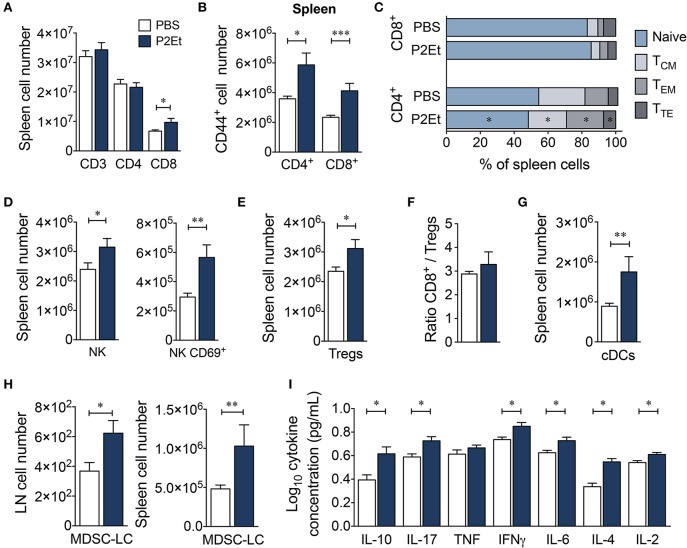
Figure 5.
P2Et treatment modulates the immune response in healthy C57BL/6 mice. (A) Absolute numbers of CD3+, CD4+ and CD8+ T cells in spleen from healthy mice treated with P2Et or PBS (control). (B) Splenic CD4+ and CD8+ T cells expressing the CD44+ marker. (C) Percentages of the different populations (naive, TCM, TEM and TTE) of splenic CD4+ and CD8+ T cells in mice with or without treatment. Absolute numbers of splenic NK and CD69-expressing NK cells (D) and regulatory T cells (E) in healthy mice treated with P2Et or PBS (F). Ratio of splenic CD8+/Treg cells. (G) Conventional splenic DC numbers in each group. (H) Absolute numbers of MDSC-LCs in lymph nodes and spleen. (I) Cytokine concentration in serum of PBS or P2Et-treated healthy C57BL/6 mice measured by CBA. In all cases, the data are represented as the mean ± SEM. The p values were calculated using a Mann-Whitney U test. *p < 0.05, **p < 0.01, ***p < 0.001.

