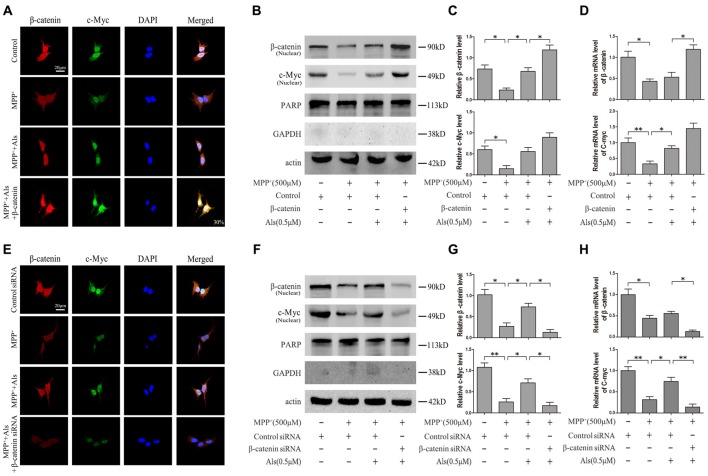
Figure 3.
Expression of c-Myc and β-catenin in the nuclear fractions and mRNA levels of SH-SY5Y cells. (A) Immunofluorescence analysis of c-Myc and β-catenin in SH-SY5Y cells. Cells were treated as described in Figure 2E (scale bar, 20 μm; Transfection efficiency, 30%). (B) Western blot analysis of the nuclear fractions of SH-SY5Y cells which were treated as described in Figure 2E. GAPDH and PARP was the markers for the cytoplasmic and nuclear fractions, respectively. (C) Quantification graphs of the β-catenin/actin and c-Myc/actin in the nuclear fractions (the means ± SEM; n = 3; *p < 0.05). (D) The mRNA level of β-catenin and c-Myc in different groups of SH-SY5Y cells, and actin served as the internal control to ensure equal loading (the means ± SEM; n = 3; *p < 0.05, **p < 0.01). (E) Immunofluorescence analysis of c-Myc and β-catenin in SH-SY5Y cells which were treated as described in Figure 2G (scale bar, 20 μM). (F) Western blot analysis of the nuclear fractions of SH-SY5Y cells which were treated as described in Figure 2G. (G) The ratios of β-catenin/actin and c-Myc/actin were analyzed (the means ± SEM; n = 3; *p < 0.05, **p < 0.01). (H) The mRNA level of β-catenin and c-Myc in different groups of SH-SY5Y cells, and actin served as the internal control to ensure equal loading (the means ± SEM; n = 3; *p < 0.05, **p < 0.01).

