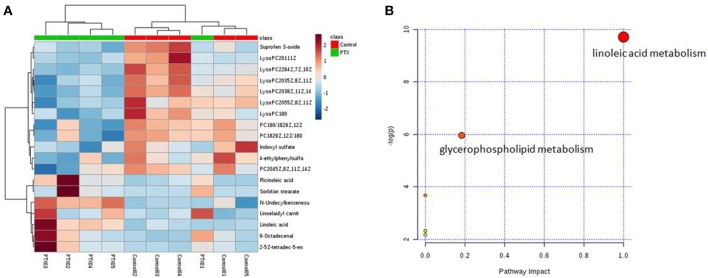
Figure 4.
Metabolites variation analysis. (A) Heatmap of metabolite concentrations. Heatmap showed the relative concentrations of differential metabolites in each sample. (B) Metabolism Pathway Affected by Paclitaxel Treatment. The result of the significant metabolites analysis showed that paclitaxel primarily disturbed the linoleic acid and glycerophospholipid metabolisms. Linoleic acid metabolism was a preferred target pathway of paclitaxel (impact 1.0).

