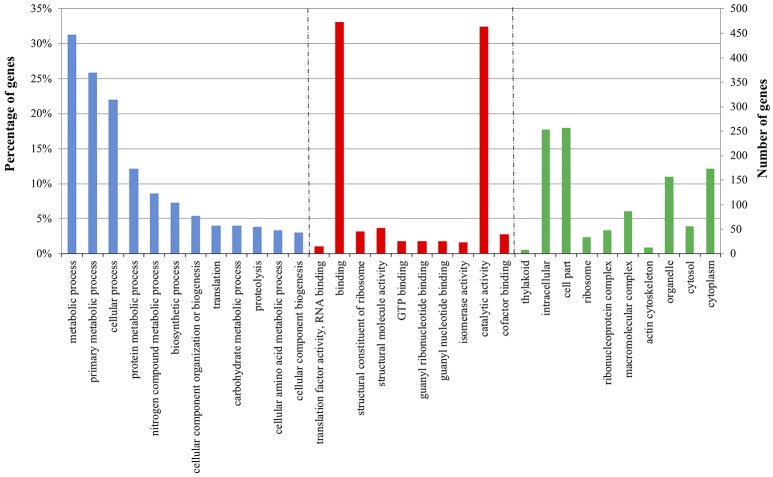
Figure 3.
Enriched Gene Ontology (GO) terms distribution of tomato DEGs in plant-Trichoderma [P+T vs. P] interaction 30 days post-inoculum. The GO terms displayed along the X-axis are grouped in three GO categories: Biological Process (blue); Molecular function (red); and Cellular component (green). The values on the Y-axis indicate tomato genes in each GO term represented as: on the left, the percentage of total genes; and on the right, the number of genes detected in each GO term.

