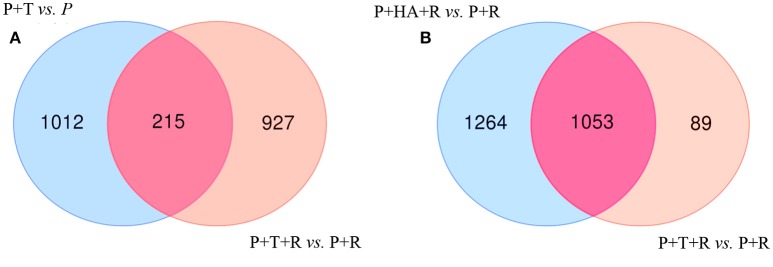
Figure 6.
Venn Diagrams showing the number of unique and overlapping DEGs in bipartite and tripartite interactions. (A) [P+T vs. P] (non- infected plants treated with M10) vs. [P+T+R vs. P+R] (infected plant treated with M10); (B) [P+HA+R vs. P+R] (infected plant treated with HA secondary metabolite) vs. [P+T+R vs. P+R] (infected plant treated with M10).

