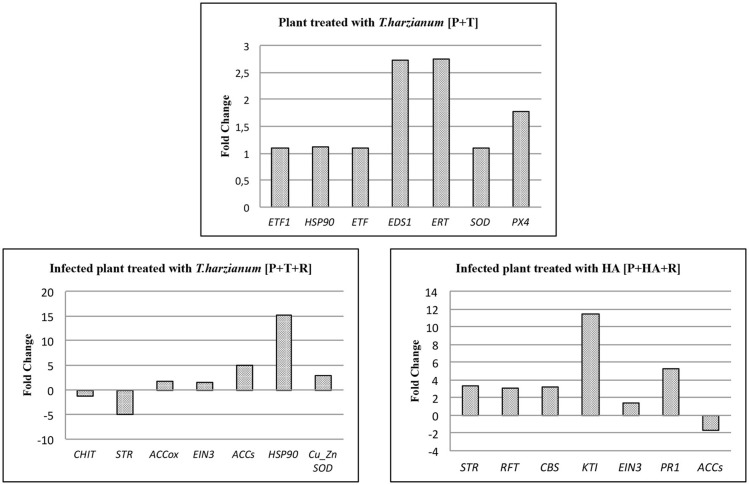
Figure 8.
qPCR assay of 7 target genes in each treatment identified by microarray analysis. Bars indicate relative expression measurements (Fold change) of target genes in treated plants respect to the calibrator (control plants). ETF1, Ethylene responsive transcription factor 1; HSP90, Heat shock protein 90; ETF, Ethylene responsive transcription factor; EDS1, Enhanced disease susceptibility 1; ERT, Ethylene responsive transcript; SOD, Superoxide dismutase; PX4, Peroxidase 4; Chit, Chitinase; STR, Strictosidine synthase family protein; ACCox, 1-aminocyclopropane-1-carboxylate oxidase; EIN3, Ethylene insensitive 3 class transcription factor; ACCs, 1-aminocyclopropane-1-carboxylate synthase; CuZnSOD, Cu/Zn-superoxide dismutase copper chaperone; RFP, Reticulon family protein; CBS, CBS domain-containing protein-like; KTI, Kunitz trypsin inhibitor; PR1, Pathogenesis related protein 1. The significance of the 2−ΔΔCt values was calculated as p < 0.05; Student's t-test.

