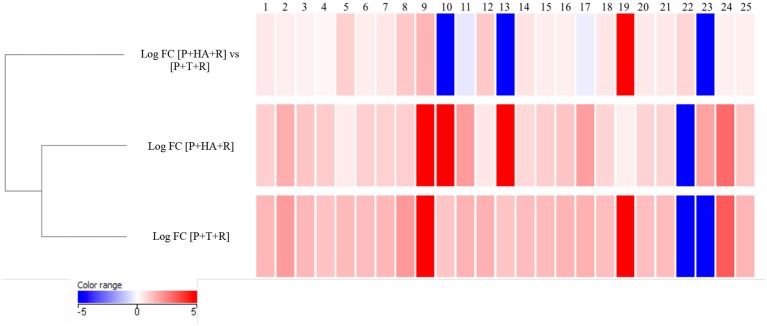
Figure 9.
Hierarchical clustering of compounds identified in methanol extract of treated plants using LC-MS in positive mode. Values are expressed in Log FC (normalized by quantile). Each compound was associated to an ID number. The identification of compounds is reported in Table 4.

