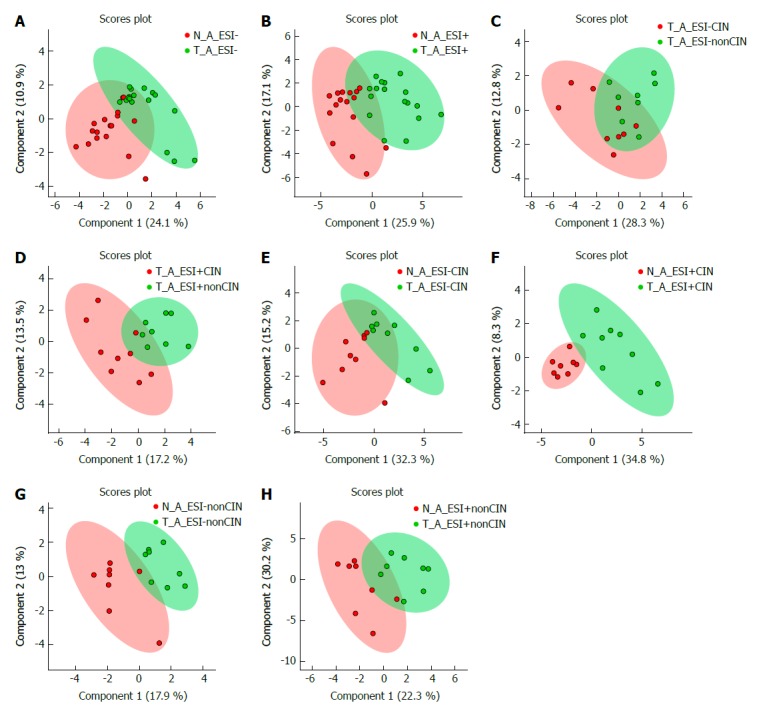
Figure 1.

Metabolite-concentration distribution of gastric cancer tumor and its surrounding healthy tissue using the partial least squares discriminate analysis statistical method. A and B: Tumor (green, n = 19) vs healthy tissue (red, n = 19); C: and D: Tumor between chromosomal instability (CIN) type (red, n = 9) and non-CIN type (green, n = 10); E and F: Tumor (green, n = 9) and healthy tissue (red, n = 9) in the CIN type; G and H: Tumor (green, n = 10) and healthy tissue (red, n = 10) in the non-CIN type. A/C/E/G and B/D/F/H defined metabolites from ESI- and ESI+ LC-MS. Arrows indicate the variation in the two groups of metabolite distribution. The straight line indicates the difference of metabolite distribution between two patient types. Within the ellipse was the 95% confidence region. CIN: Chromosomal instability; ESI: Electrospray ionization; LC-MS: Liquid chromatography-mass spectrometry.
