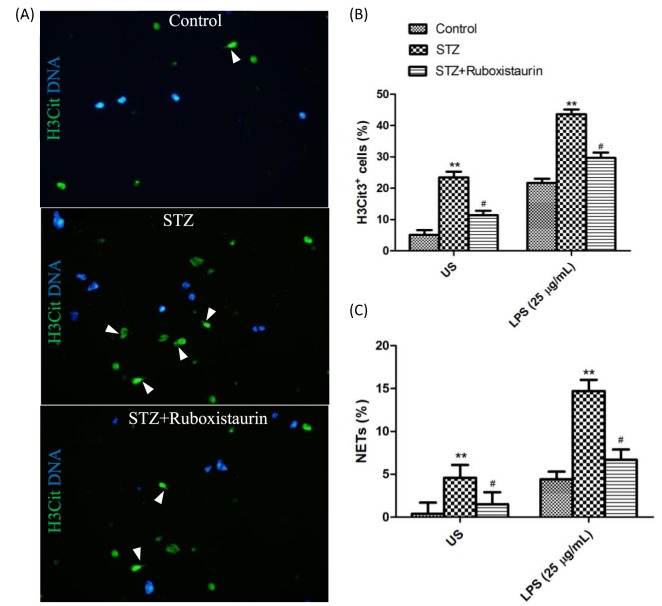
Figure 7. Representative immunofluorescence images of isolated neutrophils from mice.
Neutrophils were exposed to LPS (25 g/ml) for 2.5 h. White arrowheads indicate NETs (A). Quantitation of hypercitrullinated H3-stained neutrophils following LPS stimulation (B). Quantitation of NET-forming neutrophils following LPS stimulation (C). NETs were identified as H3Cit+ cells with spread nuclear morphology as visualized by Hoechst 33342 stain. **P<0.01 compared with control; #P<0.05 compared with STZ.

