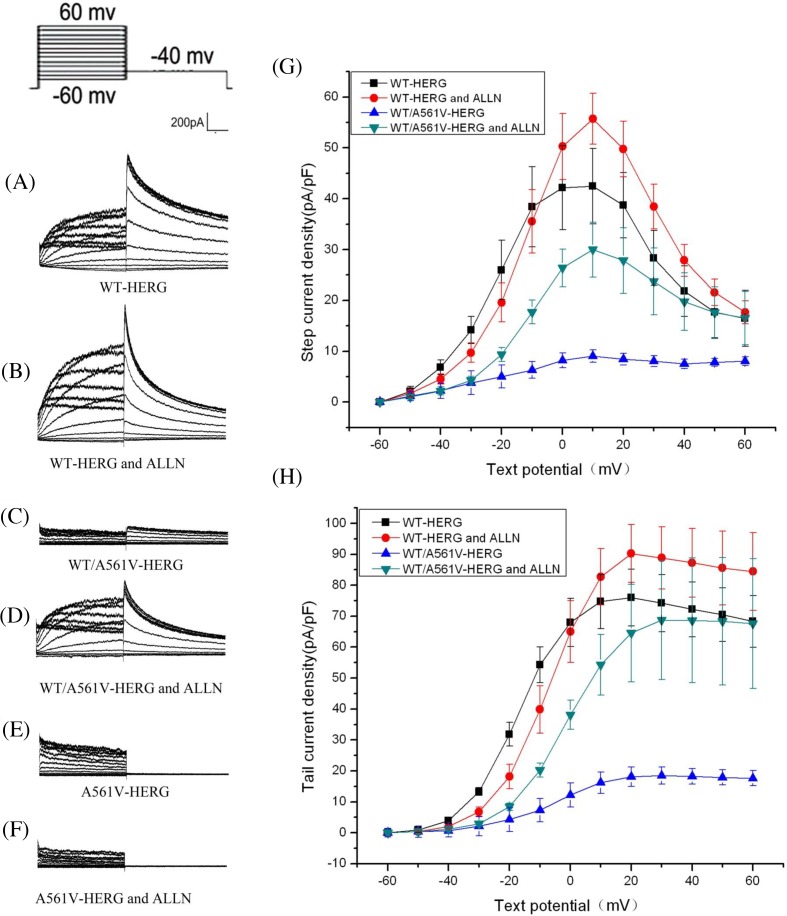
Figure 5. Effect of ALLN on the activation of HERG and the change of tail current in each group.
(A–F) represent the relationships for peak currents and tail currents amplitude of WT-HERG or A561V/HERG and A561V-HERG plasmids in presence or absence of ALLN. (G,H) represent the current density–voltage (I–V) relationships for peak currents and tail currents.

