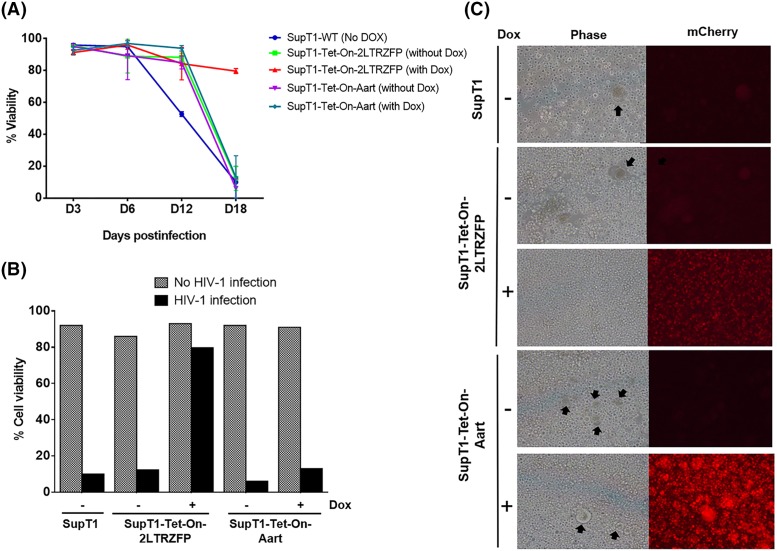
Figure 6. Cell viability and morphology of infected cells following HIV-1 challenge.
(A) Viability of Dox-induced or non-induced cells, inoculated with HIV-1 assessed throughout the experiment and (B) at D18 post-infection for viability by Trypan Blue exclusion. Results are from triplicate experiments (mean ± S.D.). (C) Cell morphology and mCherry expression were monitored by fluorescence microscopy at 100× magnification. Black arrows identify syncytia.

