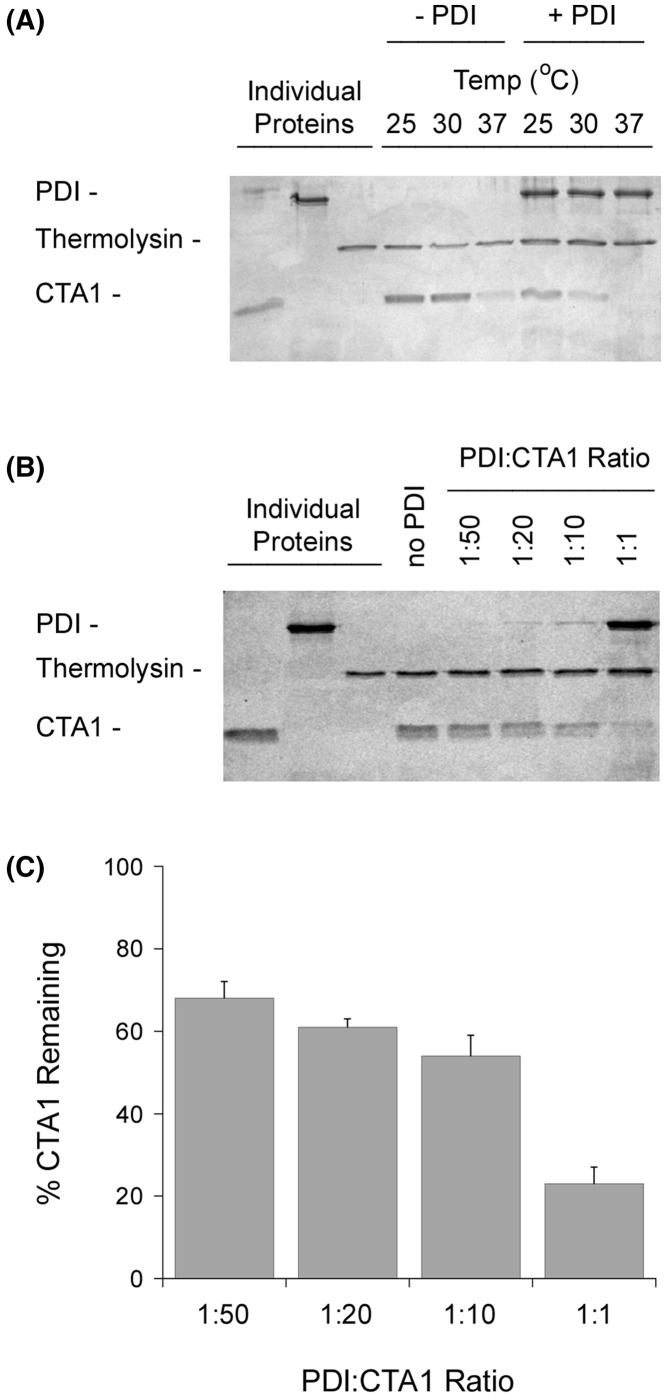
Figure 1. Effect of temperature and PDI on CTA1 protease sensitivity.
(A) CTA was placed in 20 mM sodium phosphate buffer (pH 7.4) with 1 mM GSH to reduce the CTA1/CTA2 disulfide bond. Toxin samples (1 μg) were then incubated at the indicated temperatures for 1 h in the absence or presence of equimolar PDI. All samples were subsequently placed on ice and exposed to thermolysin for 1 h at 4°C. Proteins were resolved by SDS/PAGE and visualized with Coomassie staining. Individual proteins (57 kDa PDI, 35 kDa thermolysin, and 21 kDa CTA1) representing the same quantity of material initially present in the experimental samples were also loaded, as indicated, in the far left lanes. (B) Samples of the reduced CTA1 polypeptide were incubated at 30°C for 1 h with different molar ratios of PDI. All samples were then placed on ice and exposed to thermolysin for 1 h at 4°C. Proteins were resolved by SDS/PAGE and visualized with Coomassie staining. Individual proteins representing the same quantity of material initially present in the experimental samples (1:1 ratio for PDI) were also loaded, as indicated, in the far left lanes. (C) Data from four replicate experiments represented by (B) were quantitated, with the thermolysin-treated toxin sample incubated in the absence of PDI set as the starting quantity of CTA1. Error bars report S.E.M.

