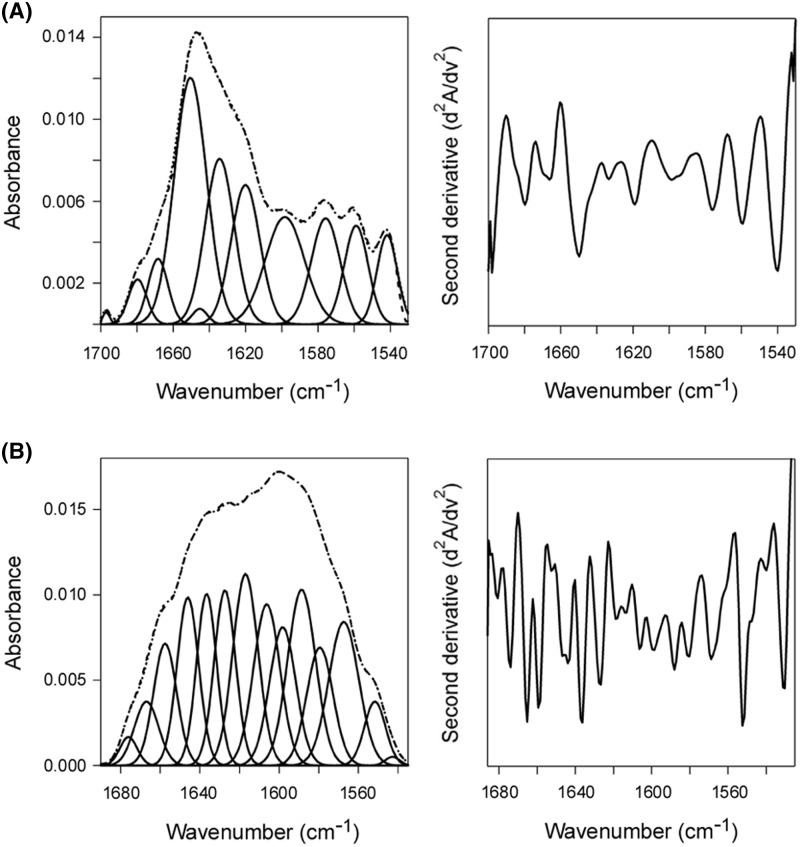
Figure 6. Glycerol does not inhibit the substrate-induced unfolding of PDI.
Curve fitting (left panels) and second derivatives (right panels) for the FTIR spectrum of reduced, glycerol-treated PDI recorded in the (A) absence or (B) presence of 13C-labeled CTA1 at 30°C. For curve fitting, the dotted line represents the sum of all deconvoluted components (solid lines) from the measured spectrum (dashed line). Deconvolution of the conformation-sensitive amide I bands determined that the secondary structure content of PDI alone contained 49 ± 2% α-helix, 36 ± 6% β-sheet, 6 ± 6% irregular, and 9 ± 1% other (mostly turn) structure. In the presence of CTA1, PDI contained 23 ± 2% α-helix, 37 ± 3% β-sheet, 26 ± 3% irregular, and 14 ± 3% other secondary structure. Values represent the averages ± S.D. of three to four separate curve fitting iterations.

