Fig. 1.
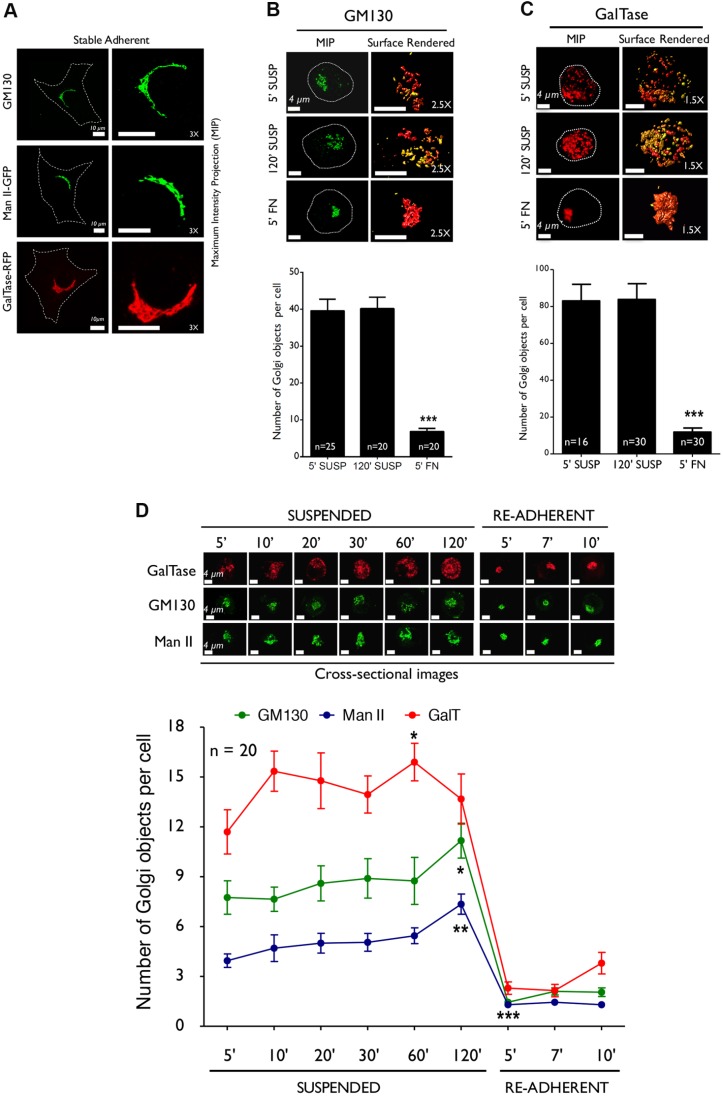
Adhesion regulates Golgi organization. (A) Stable adherent WT-MEFs were immunostained for cis-Golgi marker (GM130), transfected with the cis-medial Golgi marker (ManII) or the trans-Golgi marker (GalTase). Representative MIP (left) and 3× magnified images (right) of cells are shown. (B) Representative MIP (left) and de-convoluted surface-rendered images of non-transfected WT-MEFs that had just been detached (5′ SUSP), had been held in suspension for 120 min (120′ SUSP) and had been re-plated on FN (2 µg/ml) for 5 min (5′ FN) were stained for GM130. (C) GalTase-expressing WT-MEFs had been processed similarly. Representative MIP (left) and de-convoluted surface-rendered images (right) (magnified 2.5× for GM130 and 1.5× for GalTase) are shown. Graph represents discontinuous cis-Golgi (GM130) and trans-Golgi objects (GalTase) per cell as mean±s.e. of 16–30 cells from 3 independent experiments. (D) WT-MEFs expressing GalTase (top) or ManII (bottom), or had been immunostained with GM130 (middle) were held in suspension for increasing time points (5′, 10′, 20′, 30′, 60′, 120′ SUSPENDED) or re-adhered on FN (5′, 7′, 10′ RE-ADHERENT). Representative MIP cross-sectional images for each Golgi marker at every time point are shown. The graph represents mean±s.e. for Golgi objects in cross-sectional images of 20 cells from 2 independent experiments. Scale bars: 10 µm (A), 4 µm (B–D). Statistical analysis was done using Mann–Whitney U test (*P<0.05, **P<0.001, ***P<0.0001).

