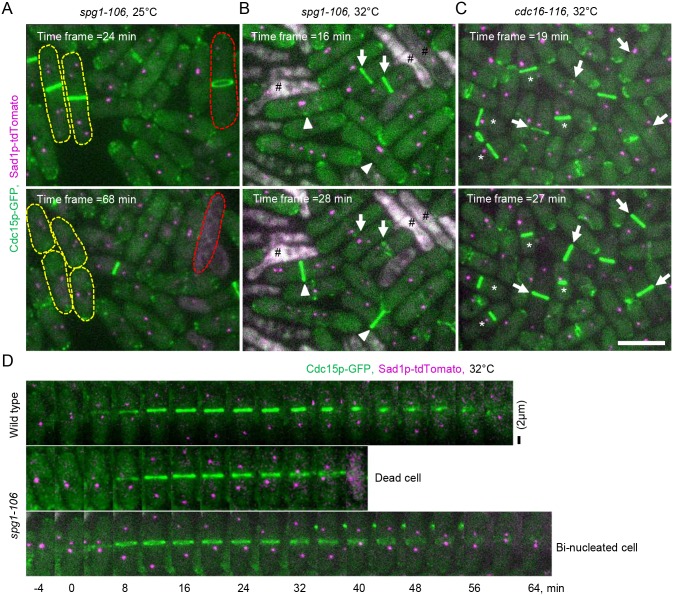
Fig. 2.
Phenotypes of SIN mutant cells at 25°C and 32°C. (A–C) Maximum intensity projections of fluorescence micrographs of asynchronous populations of cells at two times at 25°C and 60 min after shifting to 32°C. Green, Cdc15p-GFP; magenta, Sad1p–tdTomato. (A) spg1-106 mutant cells at 25°C, (B) spg1-106 mutant cells at 32°C, and (C) cdc16-116 mutant cells at 32°C. Yellow dashed lines outline two multinucleated cells that each divided into daughter cells with two nuclei. The red dashed line outlines a multinucleated cell that formed a contractile ring but lysed as the ring constricted. Arrows mark contractile rings of mitotic cells; arrowheads mark contractile rings of elongated, multinucleated cells; (#) lysed cells; (*) contractile rings in interphase cells. Scale bar: 10 µm. (D) Time series of maximum intensity projections of fluorescence micrographs at 32°C immediately shifted from 25°C to 32°C. Top panel, wild-type cells; middle panel and lower panel, spg1-106 mutant cells. Time 0 min is when the SPBs separated in each cell. Scale bar: 2 µm.

