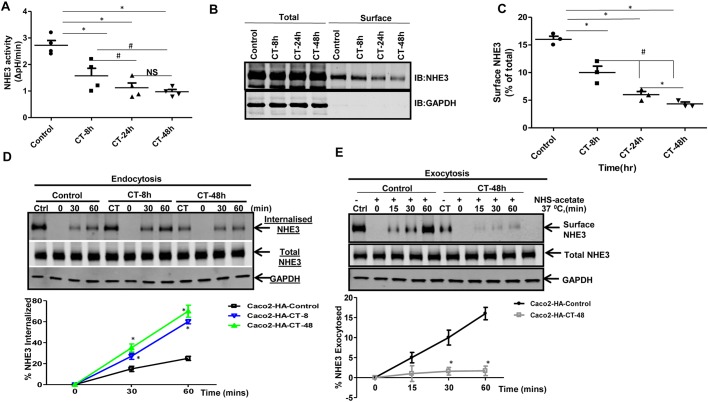
Fig. 1.
CT inhibits NHE3 activity, stimulates endocytosis and inhibits exocytosis in intestinal epithelial cells. (A) Initial rates of Na+/H+ exchange were measured in either untreated or CT-treated (100 ng/0.5 ml for 8 h, 24 h or 48 h) Caco-2/bbe-HA-NHE3 cells as the Na+-dependent pHi recovery by using the pH-sensitive dye BCECF. Results are means±s.e.m. with results from individual experiments shown; n=4 separate experiments. *P<0.05, comparison between control and CT-treated cells; #P<0.05, comparisons between 8 h and 24 h or 48 h CT-treated cells. NS, not significant. (B) Caco-2/bbe-HA-NHE3 cells were treated with CT (8 h, 24 h or 48 h) and surface NHE3 levels were analyzed. A representative western blot (IB) analysis is shown illustrating changes in PM expression of NHE3 in response to CT. (C) The quantification from at least three independent experiments, as in B, is shown for individual experiments expressed as the percentage of total along with the mean±s.e.m. *P<0.05, comparison between control and CT treatment; #P<0.05, comparison between 8 h and 24 h or 48 h CT-treated cells. (D) Rate of endocytosis of NHE3 in control (Ctrl) and CT-treated (100 ng/0.5 ml for 8 h or 48 h) confluent Caco-2/bbe-HA-NHE3 cells. Biotinylated cells were incubated at 37°C for 0, 30 and 60 min. The amount of endocytosis of NHE3 (internalization of surface NHE3) at the indicated time points was determined by a GSH-resistant endocytosis assay. A representative blot from three independent experiments is shown. Quantitative analysis of the amount of internalized/endocytosed NHE3 at each time point was calculated as the percentage of surface NHE3 of the corresponding control groups, which were always kept at 4°C and never exposed to GSH. Results are means±s.d., n=3. *P<0.05, comparison between control and CT-treated cells. (E) Rate of exocytosis of NHE3 in control (Ctrl) and CT-treated (100 ng/0.5 ml for 48 h) Caco-2/bbe-HA-NHE3 cells. Cells were incubated with NHS-acetate and then incubated for 0, 15, 30, and 60 min at 37°C to allow exocytosis of NHE3. Cells were then chilled to 4°C, and newly inserted NHE3 (exocytosed NHE3) was biotinylated and subjected to quantitative western blotting. The plot represent the mean±s.d. of three independent experiments. *P<0.05, comparison between control and CT-treated cells.

