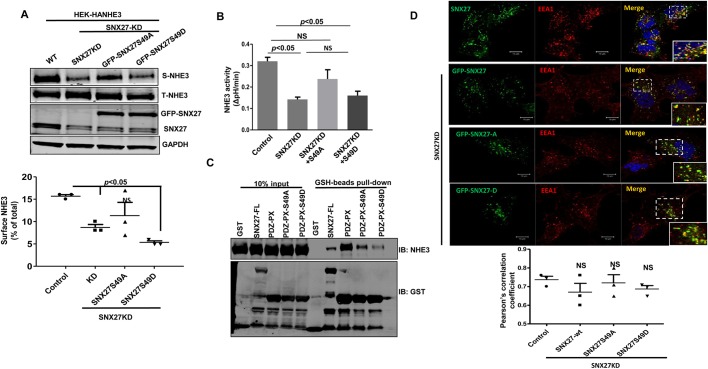
Fig. 3.
Ser49 phosphorylation of SNX27 phenocopies loss of SNX27 function. (A) Cell surface proteins were biotinylated from HEK293-HA-NHE3 cells containing control shRNA or SNX27 shRNA (SNX27-KD) with or without replacement by co-transfection of rat GFP–SNX27-PDZ-S49A or -S49D mutants. Biotinylated proteins were isolated with streptavidin–Sepharose, and the amount of biotinylated NHE3 was quantified by western blotting and compared to the amount of total NHE3. NHE3 surface expression was quantified in three independent experiments (lower panel). Results are means±s.e.m. P<0.05 and NS, not significant versus control (unpaired t-test). (B) Na+/H+ exchange was measured in HEK293-HA-NHE3 cells expressing control shRNA or SNX27 shRNA with or without reconstitution with rat GFP–SNX27-PDZ-S49A or -S49D mutants. Results are means±s.e.m., n=4. P values are as indicated. (C) GST, GST–SNX27-FL, GST–SNX27-PDZ-PX, GST–SNX27-PDZ-PX-S49A or -S49D fusion proteins were mixed with HEK-HA-NHE3-SNX27KD cell lysate and then subjected to pulldown assays with GSH resin. Samples were analyzed by western blotting (IB) with antibodies against NHE3 and GST. The experiment was repeated three times with similar results, and one representative result is shown. (D) Colocalization analysis of endogenous SNX27 or GFP–SNX27 (Alexa Fluor 488) and EE marker EEA1 (Alexa Fluor 594) in HEK WT and HEK-SNX27 depleted (shRNA) cells transfected with rat GFP–SNX27-S49A or S49D mutants. Insets are magnified views of the endosomes in the dashed box. Colocalization between SNX27 and EEA1 was quantified as the Pearson's correlation coefficient over 10 images per condition containing more than 50 cells acquired from three independent experiments. Mean±s.e.m. are shown. Scale bars: 10 μm. All results were not significantly (NS) different from control (Student's t-tests).

