Fig. 5.
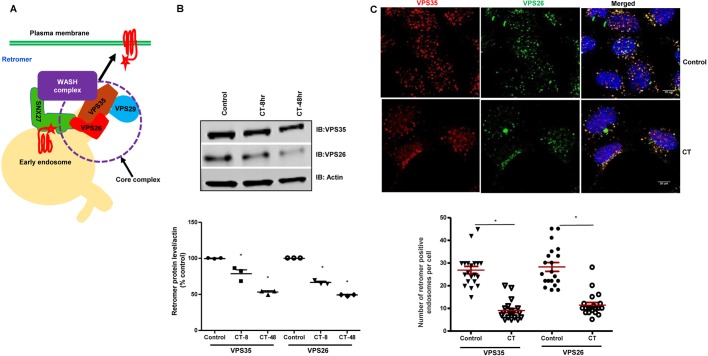
CT decreases retromer protein expression. (A) Schematic diagram of an EE illustrating the SNX27–retromer and the WASH complex. Branched tubules (arrow) represents discrete domains into which specific proteins are sorted and targeted to their respective destinations. (B) Expression of retromer proteins VPS35 and VPS26 in untreated and CT-treated (8 h and 4 times over 48 h) 14-day post confluent Caco-2/bbe cells. Western blot analysis of a representative blot is shown above. Quantitative analysis of the blots showing levels of VPS35 and VPS26 normalized to total levels of actin is shown below. Results are means±s.e.m., n=3. *P<0.05 compared to control. (C) Representative maximum intensity projections of HEK293 untreated and CT-treated (8 h) cells immunostained for VPS35 (Alexa Fluor 568) and VPS26 (Alexa Fluor 488). Numbers of VPS35 and VPS26 puncta in untreated (VPS35 60±8 puncta per cell and VPS26 56±12 puncta per cell) and CT-treated (VPS35 35±6 puncta per cell and VPS26 29±18 puncta per cell) cells are shown (n=20 cells studied from each of four separate experiments). Scale bars: 20 μm. Data are presented as means±s.e.m. *P<0.05.

