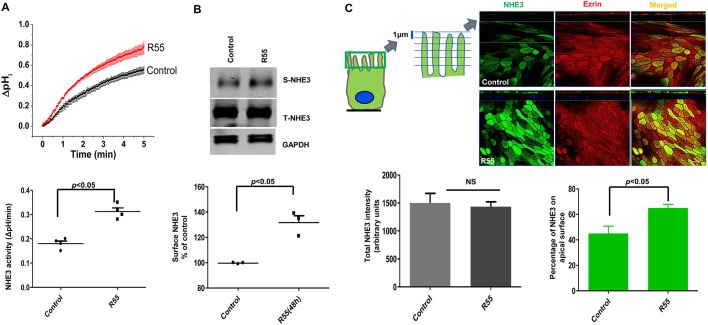
Fig. 6.
A pharmacological chaperone stimulates NHE3 trafficking to the apical membrane of human enteroids and increases NHE3 activity. (A) Differentiated human enteroid monolayers (5 days post Wnt3A removal) with higher TER than undifferentiated enteroids (1458±110 Ω cm2 vs 451±19 Ω cm2, ***P<0.001) were used. Na+/H+ exchange in human enteroid monolayers was measured using the pH-sensitive dye BCECF. A single donor was used for all experiments. Basal NHE3 transport activity was measured as the initial rates of Na+-dependent intracellular alkalinization in R55- (5 μM for 48 h) or vehicle-treated monolayers. A single experiment is shown above and below are shown means±s.e.m., n=4. P values are for the comparison between control and R55 treatment. (B) A differentiated human enteroid monolayer was treated with R55 (5 μM for 48 h) and the amount of NHE3 protein in the PM was determined by surface biotinylation. GAPDH was used as a loading control. A representative experiment is shown above and below are shown results as mean±s.e.m. (n=3 separate studies on monolayers each taken from a separate passage of the same cell line). *P<0.05. (C) NHE3 expression in human enteroid monolayers was detected by immunofluorescence (confocal microscopic) analysis. A differentiated monolayer was treated with R55 as above and stained for NHE3 (Alexa Fluro 488) and phosphorylated ezrin (Alexa Fluro 568). Each panel displays an xz projection; top panels are an xy projection, bottom panels are at the level of the apical PM. The quantification of the NHE3 intensity in control and R55 treated monolayers was performed with Volocity Software. The total NHE3 amount was not increased upon R55 treatment (lower left). The percentage of apical NHE3 in the microvillar region (stacks 1–5, each stack was 1 μm in the xz dimension and 20–25 μm total cell height) normalized to total NHE3 (whole image) expression was increased with R55 treatment (lower right). At least four separate images and ten random individual areas (z sections) were analyzed for each group. Scale bar: 10 µm. Results are mean±s.e.m., n=3. P values are comparison with untreated control.

