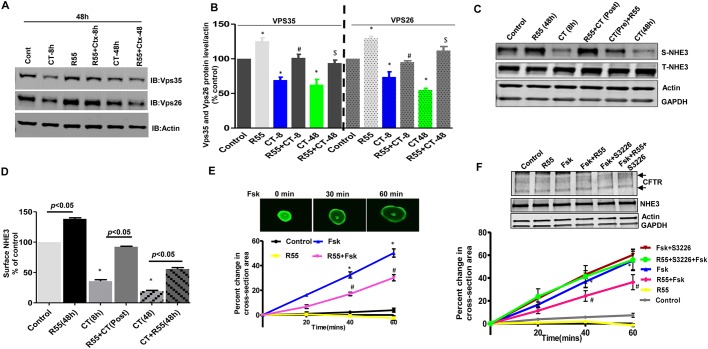
Fig. 7.
A pharmacological chaperone rescues CT-dependent retromer destabilization and stimulates fluid absorption by intestinal epithelial cells. (A) Caco-2/bbe cells were treated with either CT (8 h or 48 h) or R55 (5 μM for 48 h) or both, in pre- (CT treatment before R55 treatment) or post-combinations (CT treatment after R55 treatment) for indicated periods of time, and levels of retromer proteins VPS26 and VPS35 were analyzed using western blot analysis. A representative blot is shown. (B) Quantitative analysis of the immunoblots in A. Levels of VPS26 and VPS35 were normalized to total levels of actin (n=4 per group). *P<0.05 versus control, #P<0.05 versus CT for 8 h; $P<0.05 versus CT for 48 h. (C) Polarized Caco-2/bbe-HA-NHE3 cells were treated with CT for indicated periods of time and the effect of R55 (5 μM for 48 h) on NHE3 surface expression was analyzed in a surface biotinylation assay. S-NHE3, surface NHE3; T-NHE3, total NHE3. Results from a single experiment are shown. (D) Quantitative analysis of western blots from four separate experiments, as in C, are shown as a bar graph. The amount of surface NHE3 was normalized to total NHE3 and expressed as percentage of control. Results are means±s.e.m. P values are in comparison with the control conditions related to the individual R55 experiments. (E) FIS assay in Calcein Green-labeled human duodenal enteroids exposed to forskolin and/or R55. Upper panel, a single example of a forskolin-stimulated enteroid. Lower panel, statistical evaluation of results from four separate experiments. Surface areas, expressed as percentage increase relative to that at t=0 (100%) are indicated on the y-axis. Forskolin-stimulated (5 μM) enteroids were pre-incubated with DMSO (0.2%) or R55 (5 μM for 48 h). The surface areas of 30 enteroids were measured in each group. Results are mean±s.e.m. with average from each experiment used as n=1. *P<0.05 versus control, #P<0.05 versus forskolin. (F) Role of NHE3 in the FIS assay response to forskolin and change mediated by R55. Upper panel, a representative blot showing expression of CFTR and NHE3 in 3D enteroids used for swelling assay. Arrows indicate B and C bands of CFTR. Lower panel, normalized forskolin-induced swelling of enteroids pretreated for 1 h with DMSO or the NHE3 inhibitor S3226 (20 μM) with or without R55 (5 μM for 48 h). Contribution of NHE3 was calculated as the change induced by S3226. Results are means±s.e.m. of at least three separate experiments. *P<0.05 versus control; #P<0.05 versus forskolin.

