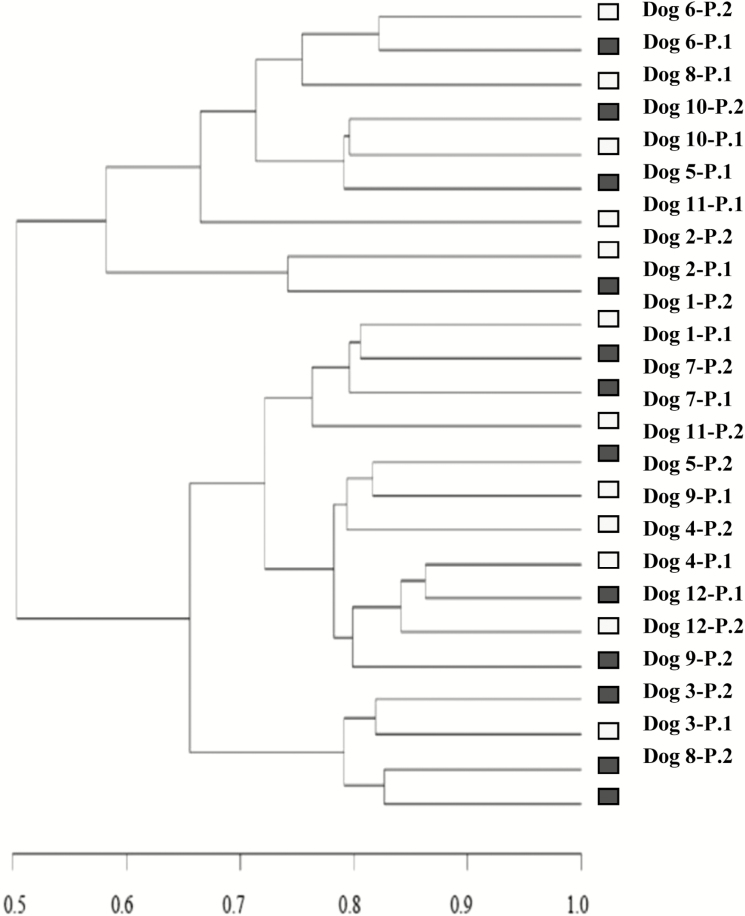
Figure 1.
Dendrogram generated from the data set of OTU obtained by NGS representing paired compared similarities based on Bray–Curtis similarity index in dogs when fed a low-fat–high-starch diet (LF–HS; □) diet or a high-fat–low-starch diet (HF–LS; ■). Each diet was distributed to half of the dogs in period 1 (P1) and to the other half in period 2 (P2).

