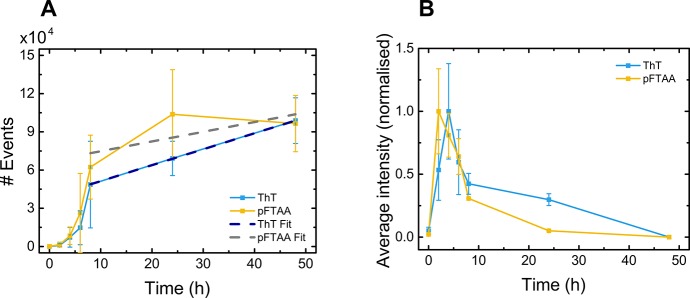
Figure 5.
(A) Number of dye-active species, tracked over the course of aggregation of αS with agitation by stirring in Tris buffer. (Inset) Number concentration data above 8 h, fitted by use of eq 4 for ThT (dark blue dashed line) and pFTAA (gray dashed line). (B) Average intensity calculated and normalized, independently, to the maximum value for both ThT and pFTAA (x̅ ± σ, n = 3).

