Figure 7.
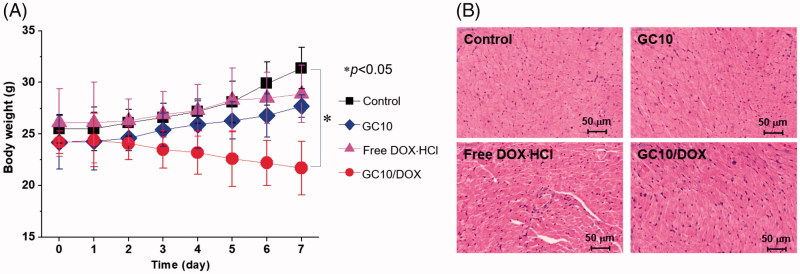
(A) Change in the body weight of control, GC10, free DOX⋅HCl and GC10/DOX-treated mice for 7 days. Error bars represent mean ± SD (n = 3); these experiments were repeated three times. (B) H&E stained images of dissected hearts extracted from control, GC10, free DOX⋅HCl and GC10/DOX-treated mice.

