
Figure 3. Transcriptome and proteome analysis of hESCs cultured in modified conditions.
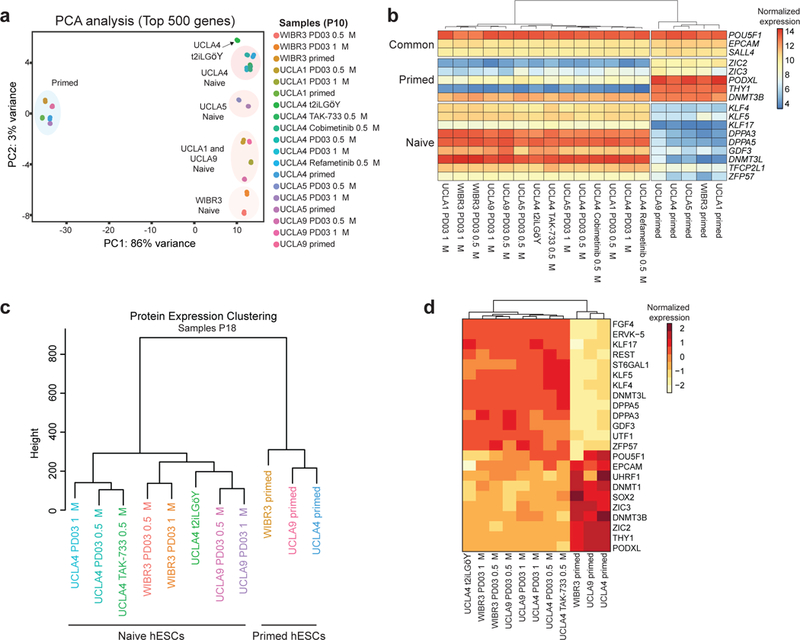
(a) PCA analysis of RNA-seq data for the indicated hESCs samples (P10) using the top 500 most variable genes. (b) Heatmap for selected primed and naïve pluripotency genes. (c) Unsupervised hierarchical clustering of proteomic samples (P18). (d) Heatmap for selected primed and naïve pluripotency proteins.