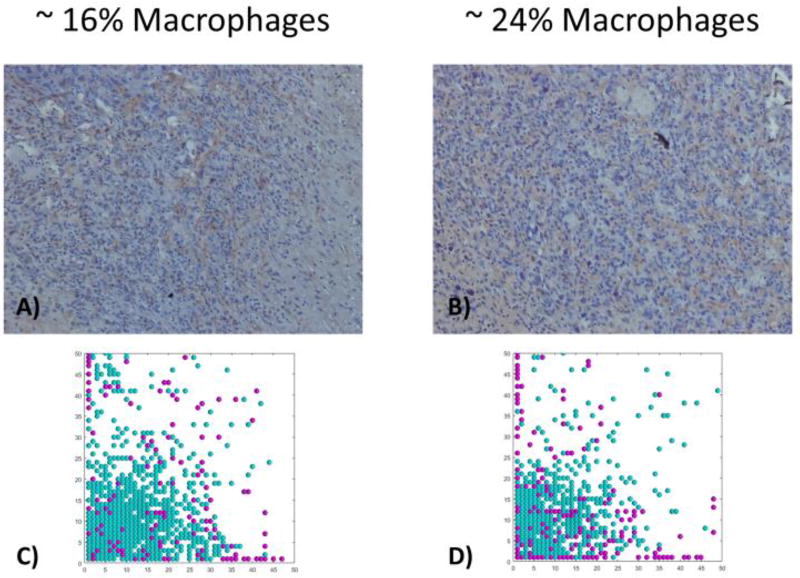
Figure 9.
Comparison of 2D in silico Tumor Slices with in vivo Samples with Macrophage Infiltration. The top panel shows two in vivo samples with increasing amounts of macrophage infiltration. The bottom panel shows two in silico tumor slices with comparable amounts of macrophage infiltration, around 14–16% for the left column and between 19–25% for the right column.

