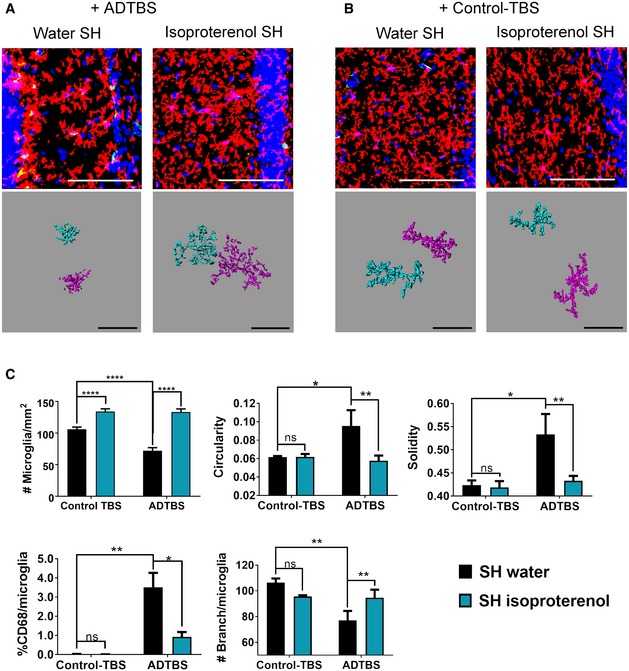
Figure 1. Isoproterenol treatment successfully neutralizes oAβ‐induced microglia morphology change in SH mice.

-
A, BRepresentative images from SH mice treated with isoproterenol vs. water and injected with ADTBS and control‐TBS. When injected with ADTBS, SH mice treated with isoproterenol have microglia with significantly less inflammatory morphological features comparing to their water control. When injected with control‐TBS, SH mice under both treatments showed minimal microglia inflammatory features. Red: P2ry12; green: CD68; blue: DAPI. Scale bar = 100 μm. Corresponding Imaris 3D‐reconstructed images featuring two cells per condition are presented under each panel. The spatial relation between each two cells may be adjusted to fit in the frame with maximum magnification. Scale bar = 50 μm.
-
CQuantification analysis of SH microglia morphology under different treatments. In control SH mice, ADTBS caused significant decrease in microglial density; increase in circularity, solidity, and %CD68; and decrease in branching complexity in comparison with control‐TBS (*P < 0.05; **P < 0.01; ****P < 0.0001, N = 6). Isoproterenol treatment significantly rescued all above‐mentioned morphological features (*P < 0.05; **P < 0.01; ****P < 0.0001, N = 6). All quantitative data are presented as mean ± SD. Exact P values are listed in Appendix Table S1. All statistical analysis were performed using multiple t‐test (unpaired, do not assume equal SDs) with Holm‐Sidak method to determine significance.
