Fig. 3.
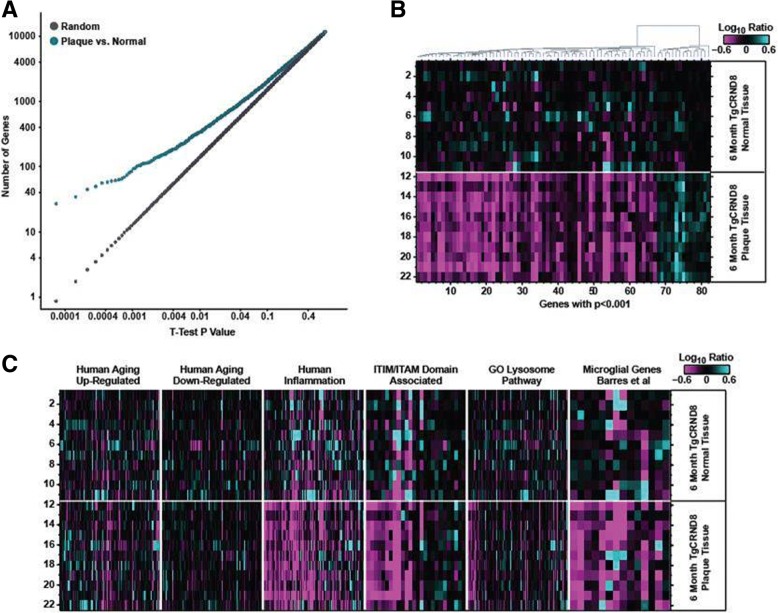
Plaque-niche gene expression differences in 6-month-old TgCRND8. a Student’s t test p value distributions for gene expression differences plaque and normal samples in TgCRND8 cortex at 6 months of age. Gray line indicates expected false discovery rate (FDR) given multiple test comparisons. b Heatmap showing log10 ratio values from each sample (y-axis) for each gene (x-axis) with t test p value < 0.001 between plaque and normal tissue in TgCRND8 cortex. Samples are ordered manually by genotype as indicated. Genes are ordered by agglomerative clustering. c Heatmaps showing log10 ratio values from each sample (y-axis) for each gene (x-axis) within the indicated gene sets. Samples are ordered manually by genotype as indicated. Genes are ordered by agglomerative clustering within each set

