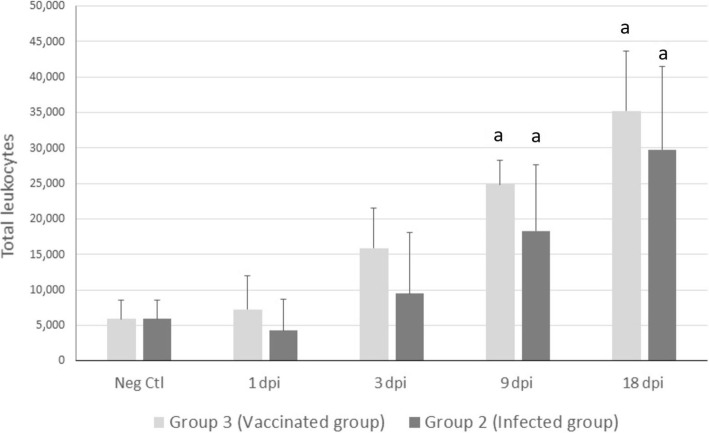
Fig. 2.
Mean total number of leukocytes illustrating the effect of infection on peritoneal cell recruitment. Cell viability was assessed by trypan blue exclusion. “a” indicates significant variations between infected (Group 2, infected group), immunised (Group 3, vaccinated group) and control (Neg Ctl) sheep (P < 0.05) at 4 slaughtering time-points: 1, 3, 9 and 18 days post-infection (dpi)

