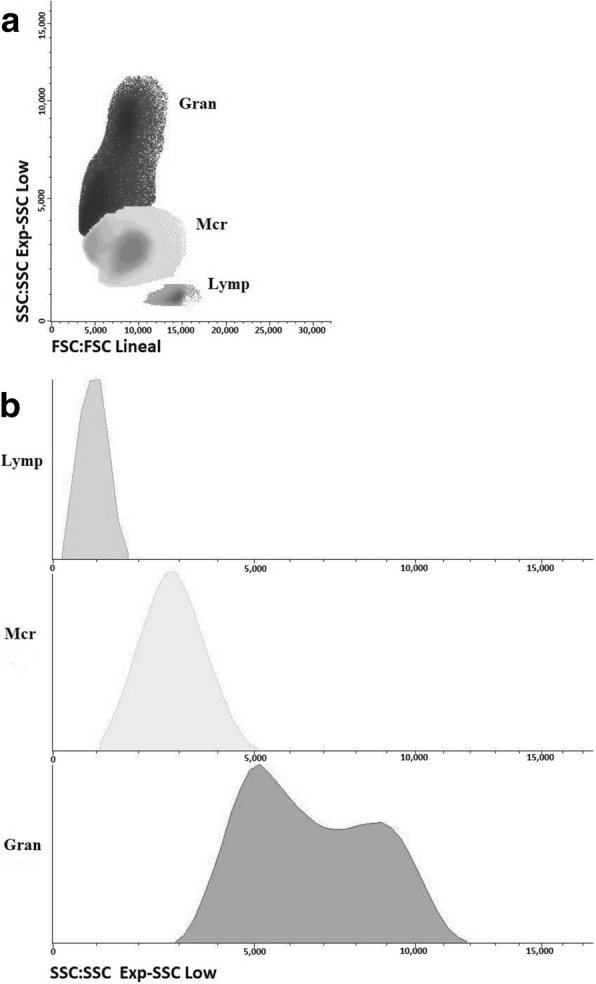
Fig. 3.

Flow cytometry analysis of peritoneal cell population of sheep after peritoneal lavage characterised by a side scatter/forward scatter (SSC/FSC) profile. Distribution of major leukocyte populations on gated regions is represented by dot-plot (a) and histogram (b). Abbreviations: Lymp, lymphocytes; Mcr, macrophages; Gran, granulocytes
