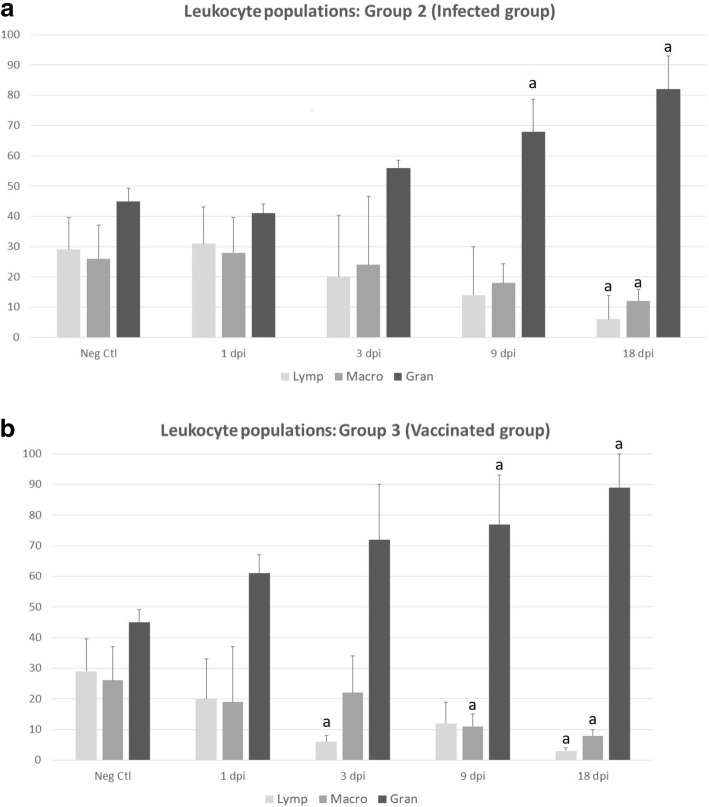
Fig. 4.
Differential cell counts by flow cytometric analysis of peritoneal lavage leukocyte samples from uninfected (Neg Ctl, Group 1, a, b), infected (Group 2, a) and vaccinated sheep (Group 3, b). Each identified cell subset is expressed as a percentage of the total number of leukocytes. Values represent the mean ± SD. “a” indicates significant differences (P < 0.05) between groups. Abbreviations: Lymp, lymphocytes; Macro, macrophages; Gran, granulocytes

